From Trace to Triage
Reading Perfetto, then handing it to an agent.
Say: Cold open on the title, no clicking through slowly — say the talk's actual claim out loud before the queue story: "This talk fixes two halves of one problem. How to read a trace yourself, and how to stop being the only one who can." One line on yourself, not a bio recitation — this is a solo run tonight, so don't reference a co-speaker anywhere in the talk.
Don't forget: confirm the room can see the screen and that fullscreen (F) is on before you start the clock.
Timing: 0:00–0:30. This is throwaway time — don't let it become 2 minutes of "can everyone see okay."
The most under-used tool in the Android toolbox.
Most teams ship, notice the app feels slow, and guess. Perfetto is how you stop guessing — it's a recording of what every thread on the device was actually doing, not a hunch.
Say: Open with the honest framing: almost nobody on a typical Android team has opened ui.perfetto.dev, even though it ships free, is made by the same org as the OS, and is the tool Android's own platform engineers use to find jank in the OS itself. That gap — powerful tool, near-zero adoption — is the reason this talk exists. The reason it stays unused isn't that it's hard, it's that nobody ever shows you the four-step loop: capture, drag, click, read — so it looks like a wall of colored bars instead of a debugger. This talk is that missing walkthrough.
Don't forget: name-drop that "performance" here means three concrete user-visible things, coming next slide: does the app feel janky while scrolling/dragging, does it feel slow to open, does it ever just freeze (ANR). Not an abstract virtue — three things a user complains about.
Timing: 0:30–1:15. Forty-five seconds.
Perfetto is a recorder, not a guesser.
Open-source, from Google, 2019. It captures kernel scheduling, app code, SurfaceFlinger, and binder — every thread, every process — on one shared clock, then replays it.
Not a profiler that samples your function. Not logcat. A full recording of the system, second by second.
Say: Perfetto ships as a suite: a small on-device daemon that records, a SQL engine (trace_processor) that queries the recording, and a web UI (ui.perfetto.dev) that renders it. You'll see all three today. It's cross-platform too — the same stack traces Android, Chrome, and Linux. The key mental shift from a profiler: a profiler asks your app "where did you spend time," and only sees your app. A trace asks the WHOLE DEVICE "what was every thread doing," so it can show you the app was actually idle, waiting on something else entirely — that's a class of bug a profiler literally cannot see, because it never looks outside your process.
Don't forget: if anyone in the room has never opened a trace before, this slide is for them specifically — don't rush it just because the room also has experts.
Timing: 1:15–2:00. Forty-five seconds.
One picture teaches all four.
Say: Point at each labeled part as you say its word — don't just read the labels, trace them with your cursor or a laser: the whole dashed box is the trace (the file). Each horizontal lane is a track — one thread here, but a track can also be a process or a counter. Each colored bar on a track is a slice — it has a name, a start time, and a duration, nothing more. And the shared ruler at the bottom that both tracks sit on is the timeline — everything lines up on one clock, which is the whole reason a system trace beats a profiler: you can see the Main/UI thread's (the app's single thread that runs layout, measure, and composition) binder_transact slice (a binder call — Android's inter-process communication mechanism, how the app talks to system_server) and RenderThread's (the system thread that actually issues GPU draw commands, separate from the UI thread) DrawFrame slice (RenderThread building/submitting that frame's GPU command list) at the exact same moment, side by side.
Don't forget: one more term for anyone who's done ART method tracing before — a flame chart/flame graph is a different, related view specific to call-stack traces, not the same as this system-wide timeline. Don't conflate the two if someone asks. Also: "track" and "slice" are literal SQL table names in the query pack you'll see later, not just UI jargon.
Timing: 2:00–2:45. Forty-five seconds — let the diagram do the work, don't over-narrate it.
One command in, one screen to learn.
Say: Set expectations for the whole talk in one breath: run a command, get a file, drag it into a browser tab. Nothing installs, nothing uploads by default. Walk the real lines on screen fast, don't dwell, but get the sequencing right: the two sed lines only EDIT a config file on your laptop — they don't start anything yet, and they add system_server (the core Android system process hosting ActivityManager, WindowManager, and most platform services — what your app's binder calls actually talk to) to the watch list alongside your own package, which is what lets binder/IPC (inter-process communication — how the app talks to system_server and other processes) and SurfaceFlinger (the system service that composites every app's rendered surface onto the actual screen) show up later. The line that actually starts recording is the one piping that config into adb shell perfetto — that's the moment a trace begins existing on the device. Tracing starts BEFORE the app does, which is exactly why cold-start mode force-stops the app first — tracing has to already be listening when the app's first line of code runs, or you lose the whole launch.
Say (second half): Point at the record_android_trace line and say this explicitly: this pattern — write a config, push it, record, pull the file — isn't something we invented for this talk. Google's own perfetto.dev docs ship a script that does the exact same four steps, for the exact same reason (raw adb shell perfetto has real gotchas: SELinux blocks non-rooted devices from some invocations, and the syntax differs pre/post Android 12). capture.sh in this repo and record_android_trace from the official repo are the same idea, independently arrived at.
Don't forget: it's .pftrace / .perfetto-trace (both extensions appear in the wild, same format), not "Hprof" — Hprof is a heap dump, a different tool for a different problem (memory, not time). Say the real filename out loud once so nobody hunts for the wrong extension later.
Timing: 2:45–3:30. Forty-five seconds — this is a preview, the live demo does the real teaching.
No install. No account. Just a browser tab.
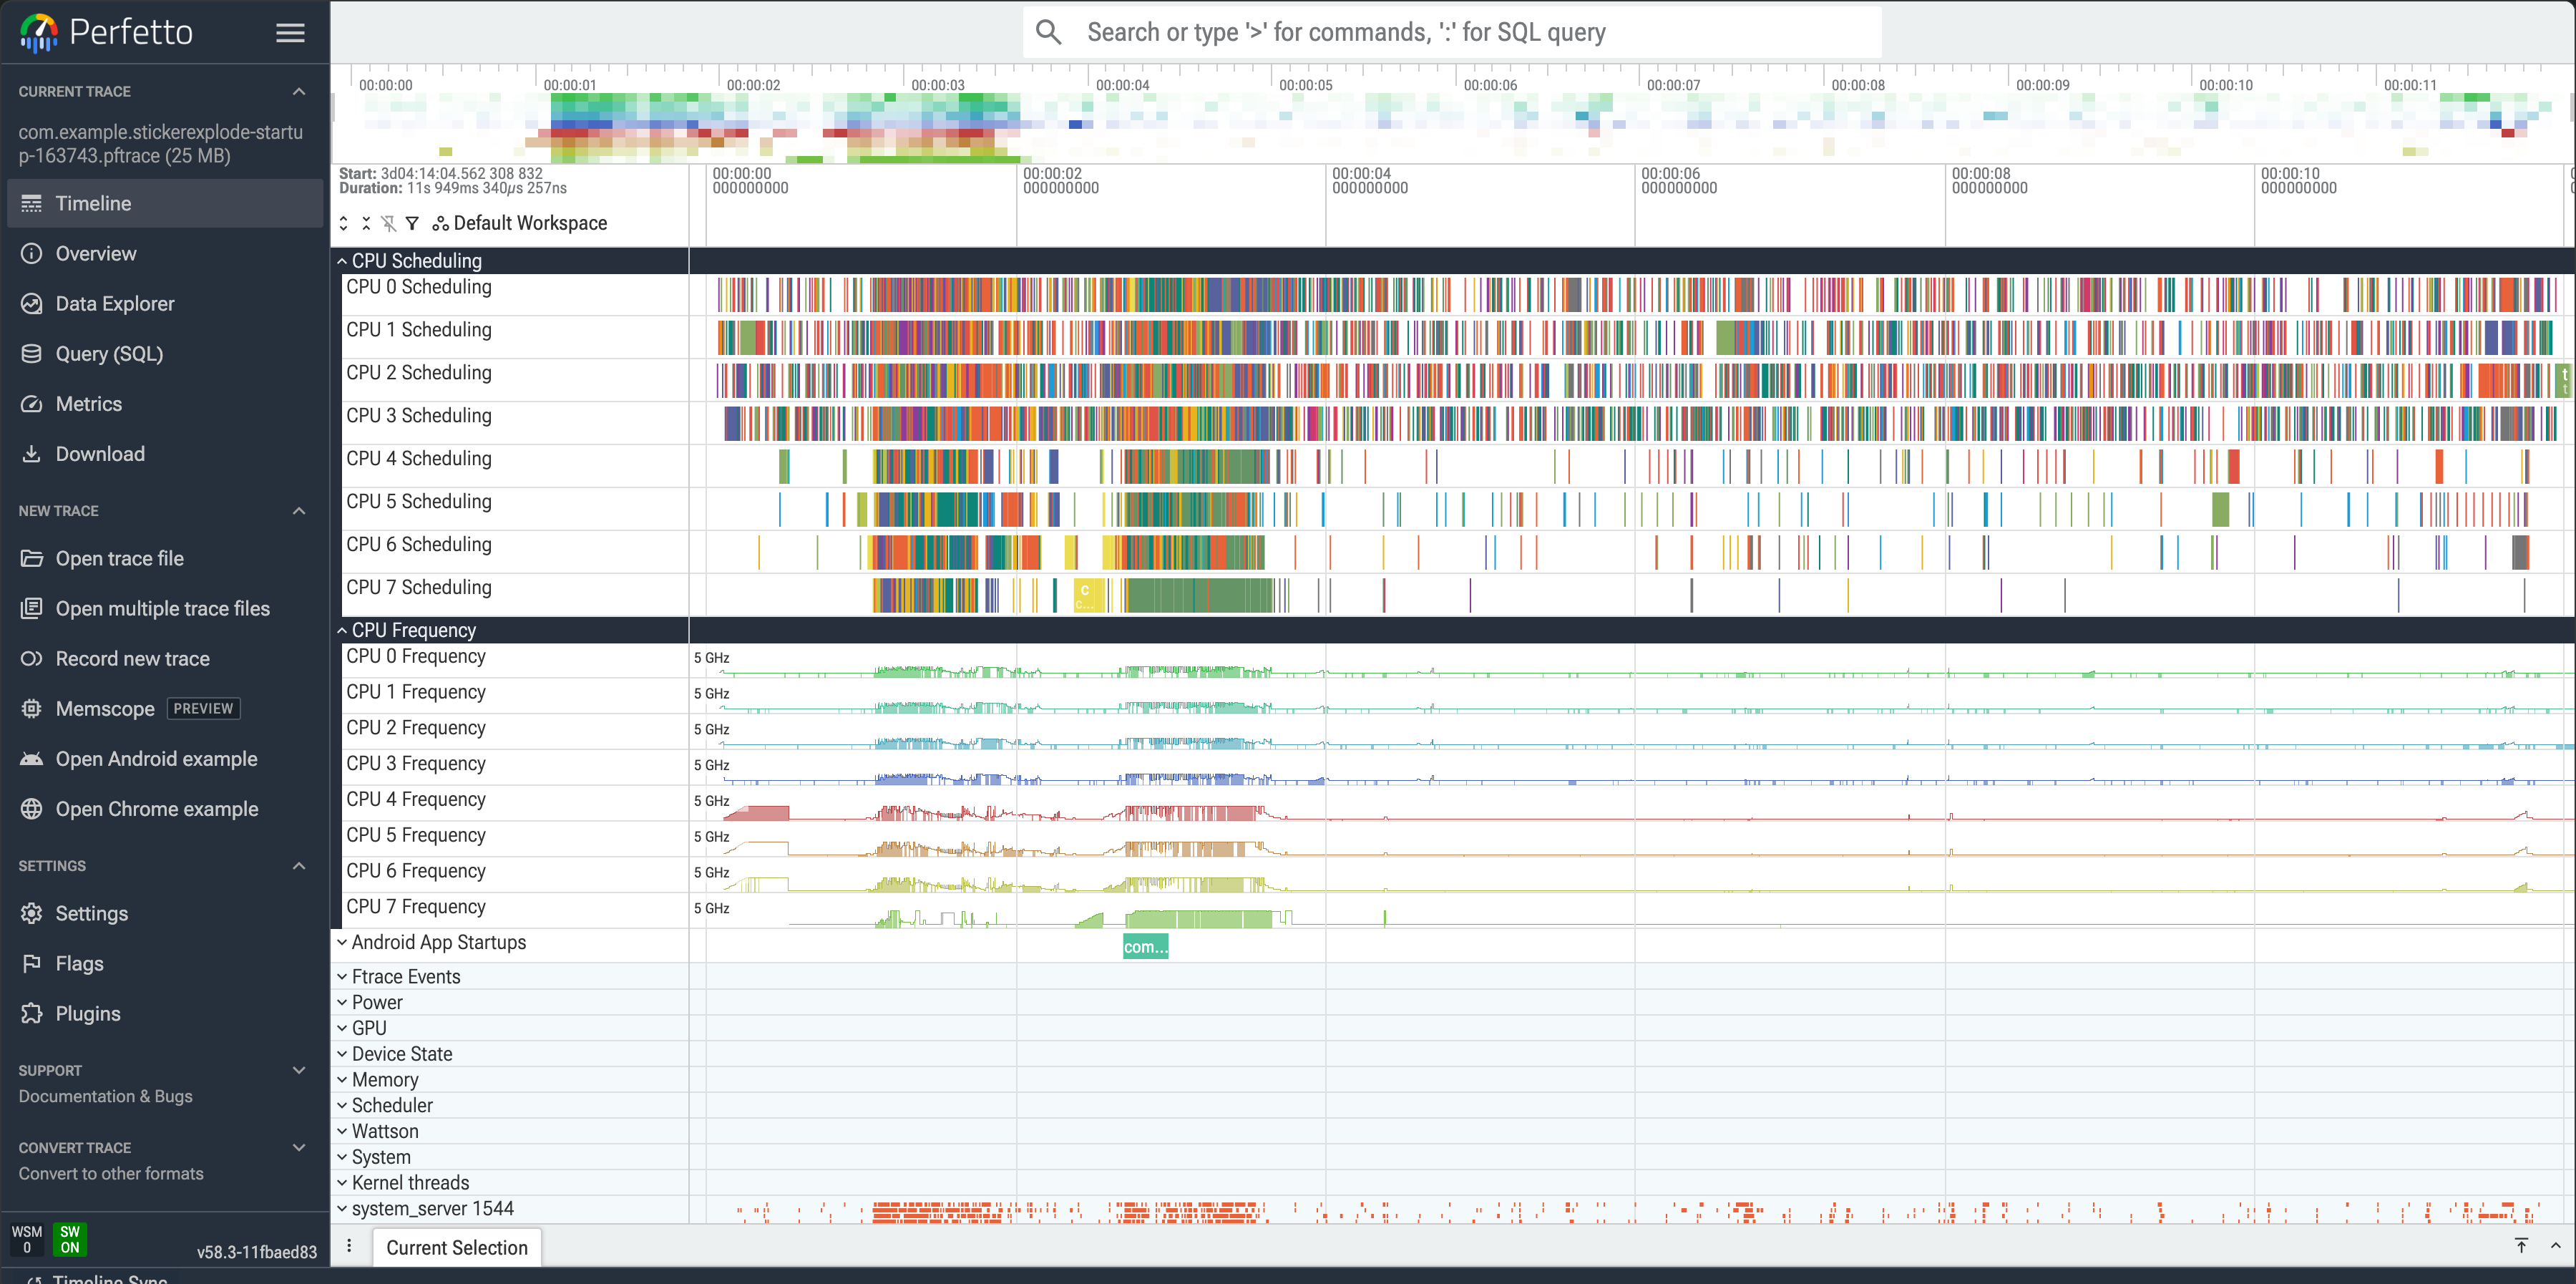
Say: This is the actual landing page, nothing hidden. Point at "Open trace file" — that's the button, drag-and-drop works too. Mention the shortcuts panel on screen: WASD to navigate the timeline is the one to remember, it comes back in two slides. Data never leaves the browser tab unless you explicitly hit Share — worth saying out loud once for anyone worried about uploading a work trace.
Don't forget: this screenshot is real, taken live off this laptop tonight — not a stock image. Say so if it comes up.
Timing: 3:15–3:30. Fifteen seconds — just orient them, don't explain every sidebar item.
CPU Scheduling, CPU Frequency, and the app's own launch — all on one clock.
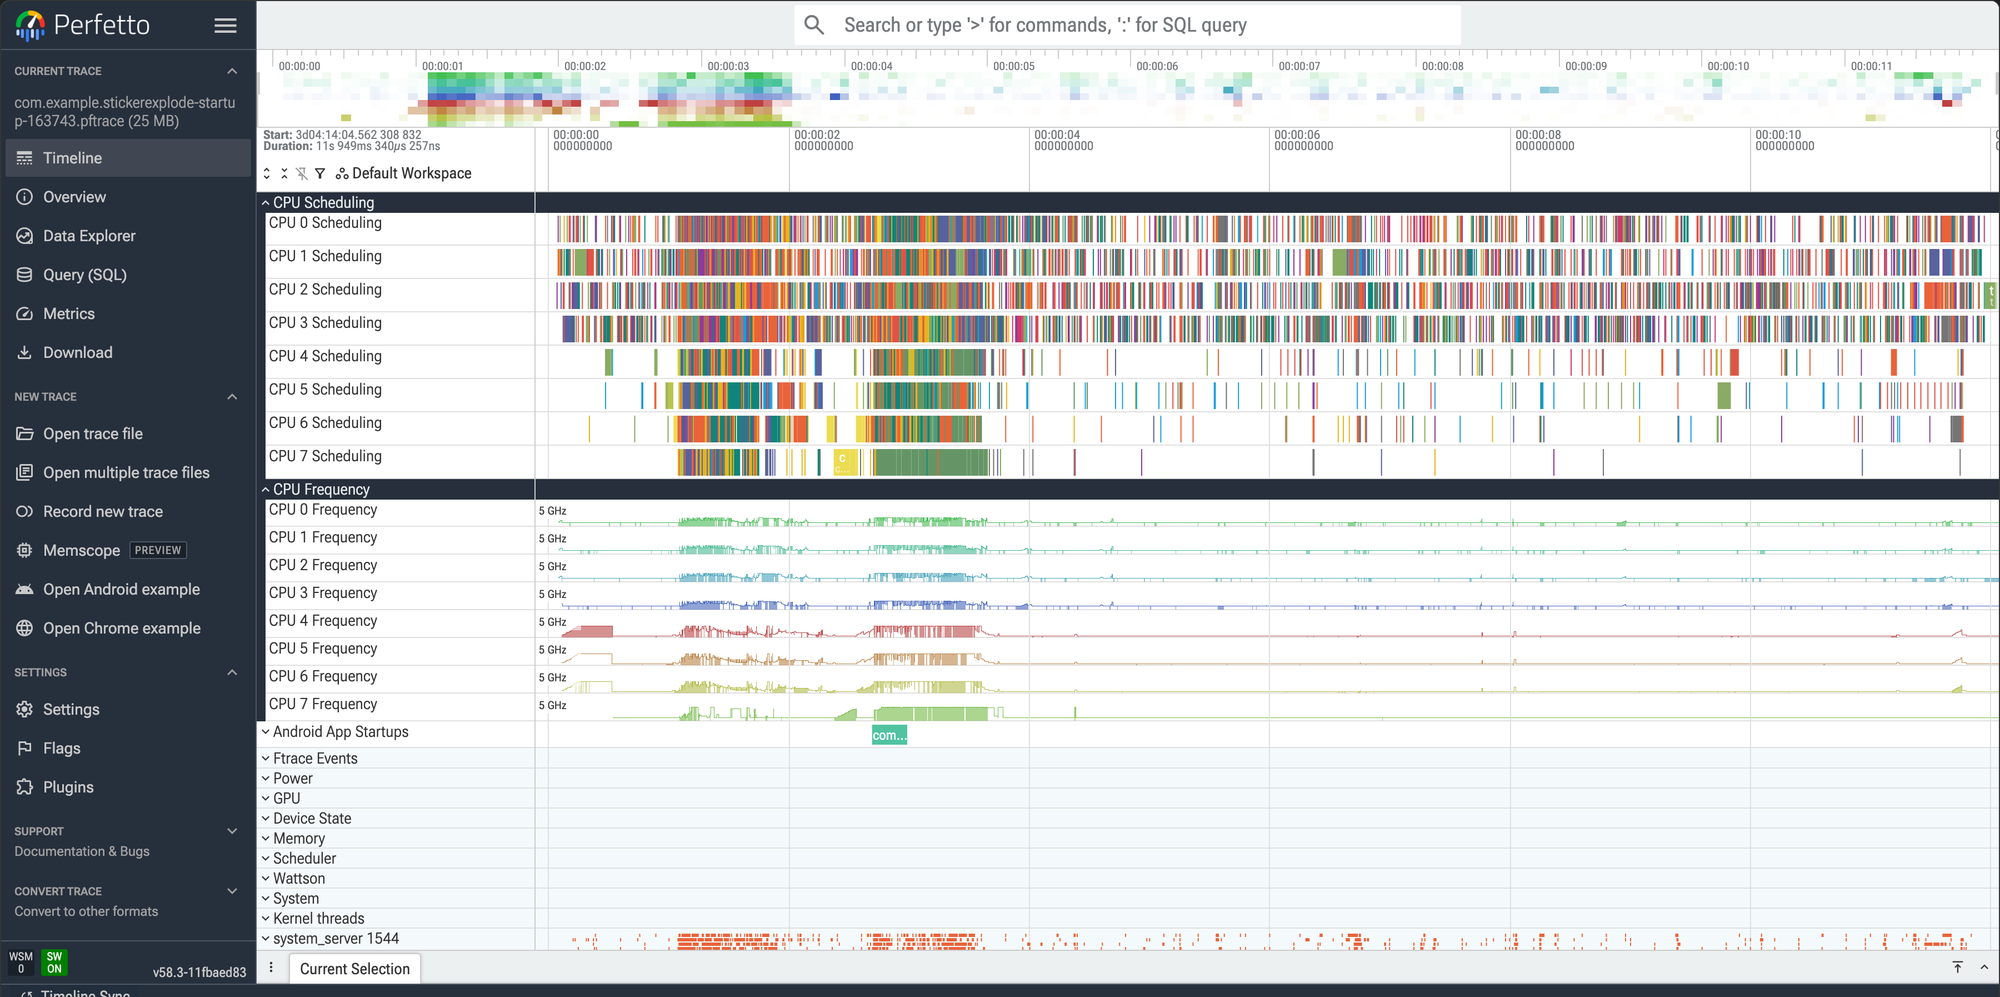
Say: This is the exact file capture.sh wrote a few minutes before this talk — 25MB, 11.9 seconds, com.example.stickerexplode. Point at the top: 8 CPU Scheduling rows, one per core, colored bars = which thread was running. Below that, CPU Frequency — watch it spike right when the app launches, that's the scheduler ramping clocks for the cold start. The thin green "Android App Startups" row in the middle is the annotation that marks exactly when this app's launch began and ended — that's the row the next few slides zoom into.
Don't forget: don't try to read individual scheduling bars from here, they're illegibly small at this zoom — say explicitly "we'll zoom into the parts that matter next," so nobody strains trying to parse this overview.
Timing: 3:30–3:50. Twenty seconds.
StickerExplode.
Pixel 9 Pro Fold, API 37, release build — never debug, debug builds run 2–5x slower and every number would be a lie.
Three things we'll measure: jank, cold start, and binder/IPC.
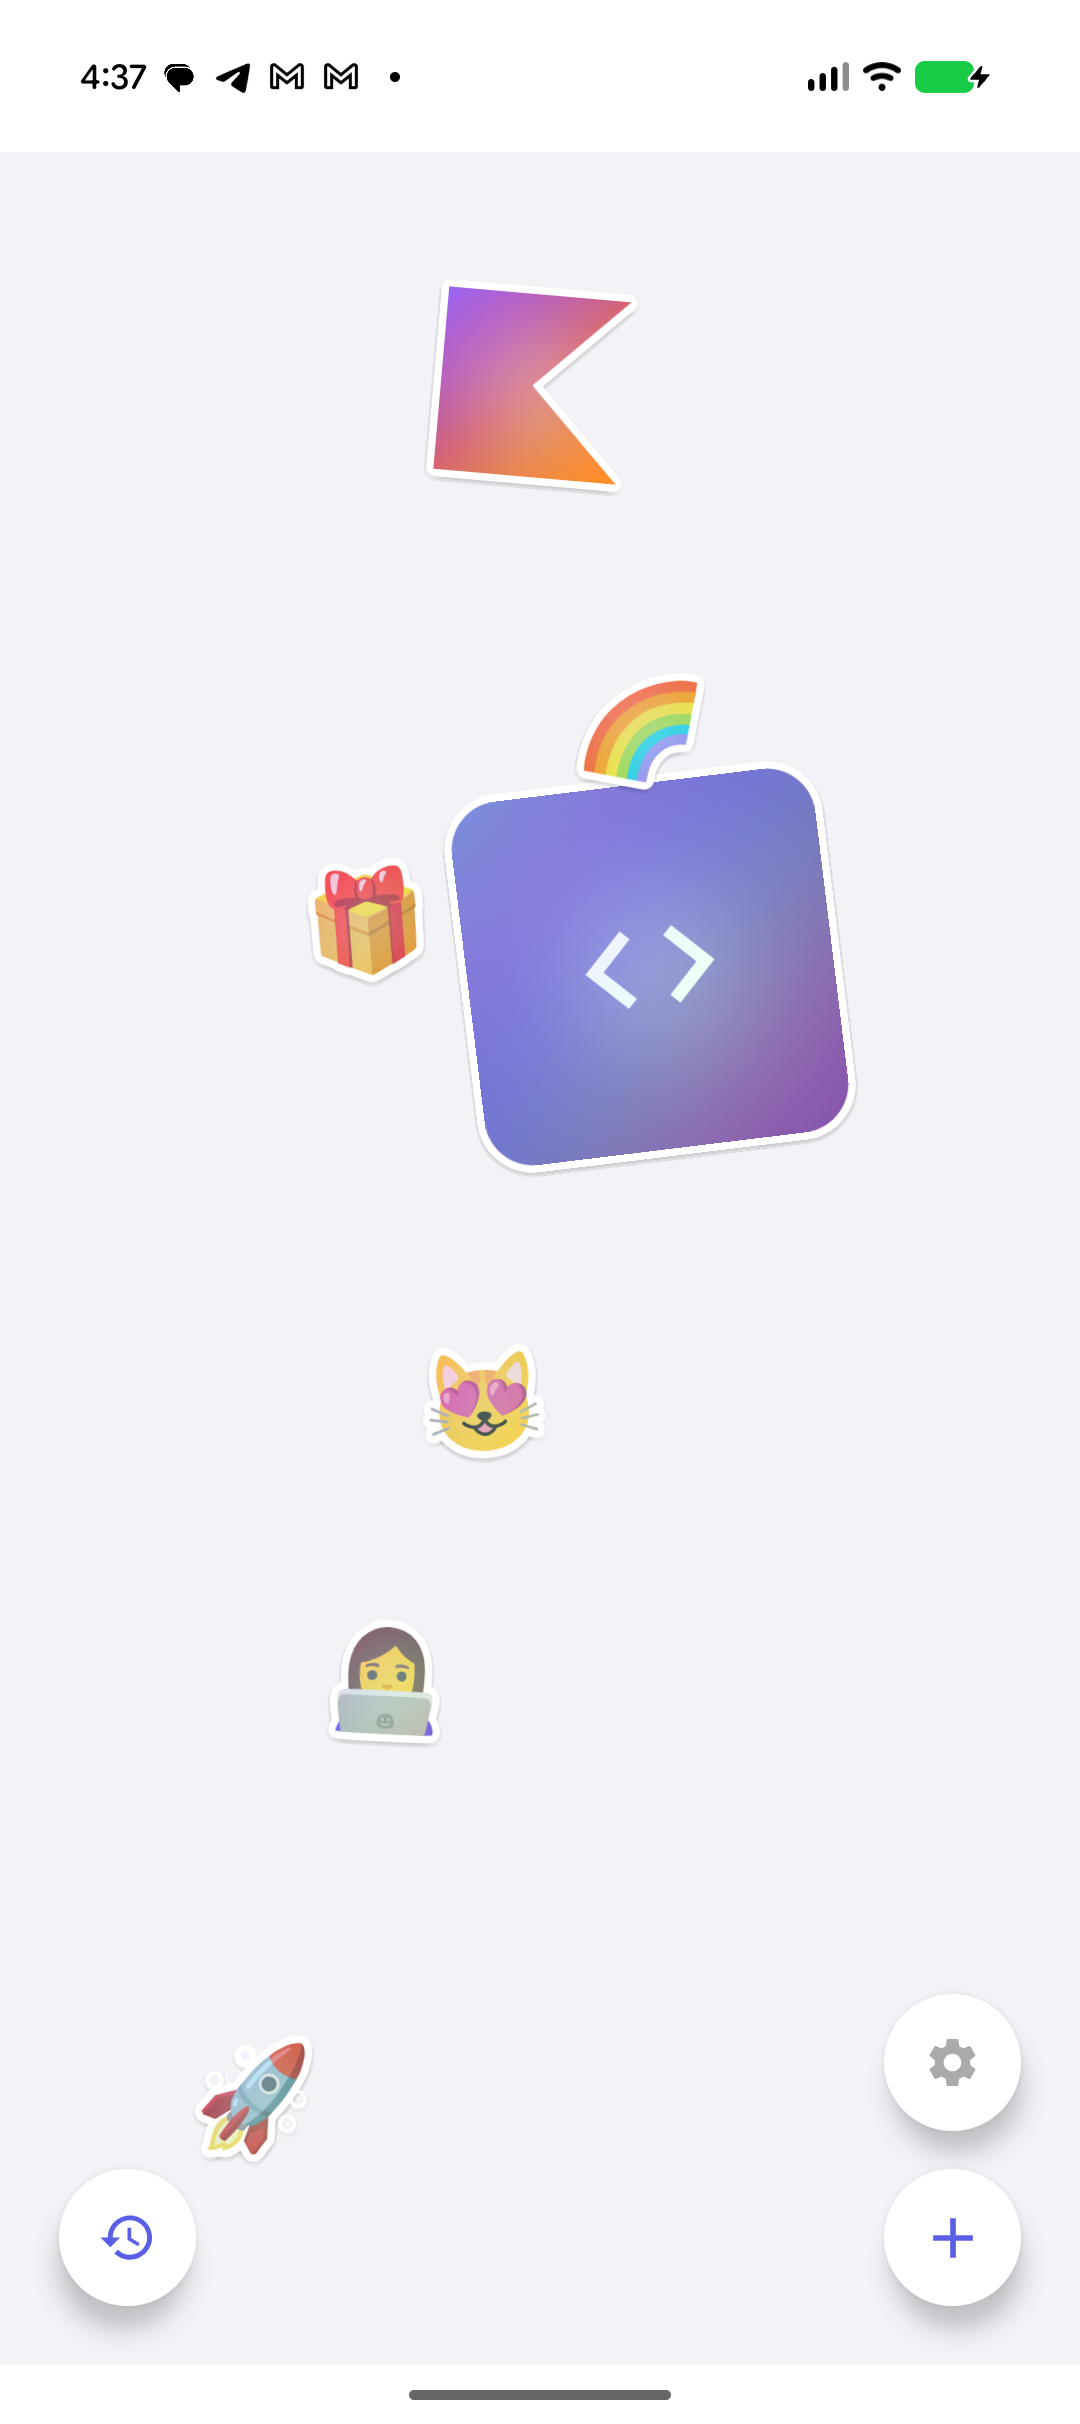
Say: Name the app once, clearly, and say why it's the right demo: it's small enough to reason about live, and every number on the next few slides came from an actual capture against it, not a synthetic example. github.com/aldefy/StickerExplode is public if anyone wants to pull it later. Say the release-build discipline out loud, don't skip it: a debug build runs 2-5x slower because the JIT hasn't warmed up and various dev-only checks are still compiled in, so a debug-build trace would make every number in this section a lie before we even started.
Don't forget: the three metrics on screen are the map for the next several minutes — say them out loud once here so the audience knows what's coming. This screenshot is real, pulled off the actual Pixel 9 Pro Fold used for every capture in this section.
Timing: 3:15–3:45. Thirty seconds.
31 of 31 frames missed their deadline.
Every frame in this capture missed budget. App-attributed: 27. SurfaceFlinger-attributed: 2. 3 frames were "big jank" — over 2x budget.
Say: This is cold-start jank, captured tonight against the release build — the launch itself is janky, not just the drag interaction people usually check. Point at the ranking: worst frame missed by 144ms, nearly 9x the 16.6ms budget. The finding that matters: app-attributed dominates (27 of 29 attributable frames) — this is "fix your code," not "blame SurfaceFlinger."
Don't forget: real numbers, real capture, tonight — not carried over from an old run. If asked why cold start alone is janky: 5,068 classes loading concurrently with the first frames is a strong suspect, ties directly back to the previous slide's chart.
Timing: 4:20–5:20. One minute.
Cost lands on the UI thread, not RenderThread.
UI thread cost exceeds RenderThread — measure/layout/recomposition, not GPU/buffer waits, for this capture.
Say: First, ground the three terms on this chart before the numbers — this is worth 15 seconds even under time pressure: every frame starts at VSync (the display's fixed refresh tick — 16.6ms apart at 60Hz), then the UI thread (= main thread — your code: layout, measure, and in Compose, composition/recomposition) does its work, then hands off to RenderThread (a separate SYSTEM thread, not your code, that takes what UI thread decided and issues the actual GPU draw commands). "vsync delay" on this chart is the gap between the tick that should've started the frame and when work actually began — high vsync delay usually means something upstream held the frame back.
Say (second half): Different verdict than the drag-interaction case this deck used to cite — that's the point of measuring instead of assuming. In THIS capture, cold start, UI thread cost (539ms) beats RenderThread (405ms): the bottleneck is measure/layout/recomposition on the main thread, not GPU/buffer waits. Different root cause, different fix — profiling your own Compose code is actually the right move here, not chasing RenderThread.
Don't forget: this is the SAME distinction as the four-question method's Q2 (running vs waiting) — call that forward explicitly, it's the thread that ties Part 2 back to the method half later. Also flag honestly: an earlier drag-interaction capture in this same app showed the opposite (RenderThread-bound) — both are real, they're just different scenarios, which is exactly why you check every time instead of assuming last time's answer still holds.
Timing: 5:20–6:05. Forty-five seconds — the term recap adds ~15s, still fits.
Every slice, ranked. The widest bar is where your time went.
Say: Walk this bar by bar, top to bottom, out loud — the chart already says the numbers, your job is the "so what": bindApplication (175ms) is the top-level container for almost everything below it, it's not itself the cause. Look inside it: OpenDexFilesFromOat and the doFrame (Choreographer's per-frame callback — the UI thread doing that frame's input/animation/layout work) that follows are both ~159ms — that's dex loading and the first real frame, back to back. Extract dex file and Verify dex file together are another ~135ms — all three of those bars are class-loading and verification, not your Compose code. 5,068 classes loaded, only 41ms actually on the critical path, everything else overlaps. That's the Baseline Profile signal: generate one with BaselineProfileRule, benchmark CompilationMode.None() against CompilationMode.Partial(BaselineProfileMode.Require).
Say (second half): Point at binder transaction — 71 calls, 35ms — small compared to dex loading, but real, and it's a preview of the binder slide coming up. Compose:recompose at 51ms across 2 calls is the only line that's actually your code; everything above it in this chart is framework/OS work.
Don't forget: mention the instability honestly if it comes up — three captures earlier tonight against this same app registered NO startup event at all (0/0 search results), before a 1s→3s timing fix in capture.sh resolved it. That's real, reproducible flakiness in the tool, not cherry-picked data — the next slide covers exactly why.
Timing: 6:05–7:05. One minute.
android_startups is a view, not a setting. It reads atrace events after the fact.
Say: Answer the question directly, this is exactly what "app startup time, Perfetto trace" means: there's no button called "measure startup." android_startups is a real PerfettoSQL stdlib view (android.startup.startups module) that reads the am/wm atrace events (atrace = Android's userspace tracing tag system — it labels raw kernel scheduling data with human-readable names like "bindApplication" or "doFrame"; the "am" category specifically tags ActivityManager events, the app-launch lifecycle) already in the trace and infers where a launch began and ended. TTID and TTFD are a SEPARATE module (android.startup.time_to_display) layered on top — TTID is literally defined as "time to the first RenderThread.DrawFrame" (RenderThread = the system thread that issues GPU draw commands, separate from your app's main/UI thread), TTFD as "time to the next DrawFrame after reportFullyDrawn() fires." Both need the underlying am events to exist first.
Say (second half): Reproduced the failure live tonight, three captures in a row against the correct release build: search "Android App Startups" in the UI, 0/0 results every time. That's this exact race — the am events have to land inside the recording window, and capture.sh's own 1-second sleep between "tracing starts" and "force-stop the app" was tight enough to sometimes lose that race. Fixed live tonight: bumped it to 3 seconds, recaptured, android_startups populated correctly (search went from 0/0 to 1/11). That fix is already applied to the real capture.sh in this repo.
Don't forget: this is Q1 made concrete — "is this trace trustworthy" isn't rhetorical, it's this exact failure mode, reproduced live, sourced from the actual perfetto.dev stdlib docs, not guessed. Say explicitly: doFrame and RenderThread data survive fine even when startups don't — a missing startup doesn't invalidate the whole trace, just that one specific metric.
Timing: 7:05–7:50. Forty-five seconds.
Queueing, not computing.
42.3ms sleeping vs 1.5ms actually running. The server isn't slow — the client is descheduled waiting for a free binder thread.
Say: This is the "waiting, not running" case made concrete with real binder data, tonight, off the release build. The chart is the client thread's own scheduling state during every binder wait in this capture: 42.3ms total spent sleeping, versus 1.5ms actually running. That ratio is the whole argument — the instinct is always "make the server faster," but the client's own state says it's asleep, not blocked on server compute.
Say (second half): Name the specific call: SensorEventConnection, 2 calls, 25.4ms combined, worst single call 13.4ms — that's the top main-thread binder cost in this exact capture, cross-referenced against the cold-start chart two slides back where the SAME 71 binder transactions showed up as one 35ms bar.
Don't forget: the fix framing — fewer calls helps more than a faster server, because the server-side compute was never the bottleneck.
Timing: 7:45–8:45. One minute.
Three real findings. One repeatable method behind all three.
Here's the part that doesn't depend on StickerExplode at all.
Say: Bridge line into the existing hook/method section: everything you just saw came from asking the same four questions, in the same order, every time — is the trace trustworthy, was the thread running or waiting, whose deadline was missed, where does startup time actually go. Say explicitly that the ORDER is what you're about to teach, not just the four topics — ask them out of sequence and you burn a week optimizing code that was never the bottleneck.
Don't forget: keep this fast — it's a transition, not new content.
Timing: 8:45–9:00. Fifteen seconds.
One timeline. Kernel, framework, SurfaceFlinger, binder.
A profiler tells you your function was slow. A trace tells you why the thread wasn't running at all.
Say: A CPU profiler samples your code and shows you time-in-function. A system trace shows every thread in every process, scheduling state included, on one shared clock. That's the difference that matters for question 2 next.
Don't forget: tease the number that's coming — "a 40ms method that was descheduled for 32 of them" — without giving away the full slide yet.
Timing: 9:00–10:00.
The method took 40ms. The code ran for 8.
Say: Walk the bar left to right without naming the four questions yet — just narrate what's visible: code runs, then something blocks it for the vast majority of the window, then it resumes. That gap is the whole talk in one picture.
Don't forget: this diagram reappears full-size later (slide with the binder wait) — don't over-explain it now, just plant it.
Timing: 10:00–10:45.
Four questions, and the order is the expertise.
- Is this trace trustworthy?
- Was the main thread running or waiting?
- Which deadline was missed, and by whom?
- Where does cold start actually go?
Say: Say the order matters, explicitly: ask them out of sequence and you spend a week optimising code that was never running. This slide is the map for the next 19 minutes — the small indicator top-right will track which question you're on.
Don't forget: point at the four-dot indicator in the corner once here so the audience knows what it is before it starts lighting up.
Timing: 10:45–11:15 — fast, this is a preview not the content.
Is this trace trustworthy?
- Dropped data — buffer overflowed mid-capture
- Missing FrameTimeline — no jank attribution possible
- Debuggable build — 2 to 5x slower, numbers are a lie
Say: Before any conclusion, check the trace itself. A trace that looks fine on the surface can be missing the one data source you need. This is the step everyone skips because it feels like paperwork.
Don't forget: name the two query files that check this — 00_health and 01_coverage — you'll reuse those names later when the agent runs them.
Timing: 11:15–12:15.
Two queries. One asks "did anything break?" The other asks "is the data actually there?"
Checks trace_processor's own error/data-loss stats. Any row here means the buffer dropped data or a source failed — every number downstream would be a lie.
Counts rows from every data source the trace needs. A 0 in any column means that whole CLASS of question is unanswerable with this capture.
Say: Two DIFFERENT checks, and the difference matters — 00_health asks "did trace_processor itself detect a problem" (dropped buffer, missing source); empty result there is GOOD. 01_coverage asks a completely different question: "even with no errors, is there enough DATA to answer what I'm about to ask." A trace can pass 00_health and still be useless for jank questions if frametimeline_rows is 0 — that's the trap from the previous version of this slide. Run both, tonight, against our real capture: 00_health came back empty (pass), and every single column in 01_coverage is non-zero — sched data, frame timeline, binder, blocked-reason, all present. That's what "trustworthy" concretely means: not one number, six of them, all real.
Don't forget: if anyone asks "what would UNHEALTHY look like" — 00_health would show actual rows (an error name + severity), and 01_coverage would show a 0 in whichever column maps to the question you can no longer ask. Point back to the earlier android_startups slide — that WAS an unhealthy-for-one-purpose trace, still healthy for others.
Don't forget: say the fix out loud — recapture with the right categories — don't leave the audience thinking the app is fine.
Timing: 12:15–13:45.
Was the main thread running, or waiting?
Running means your code is slow. Waiting means it was blocked — and profiling your own code will find nothing.
Say: This is the fork that changes the entire fix. If it's running, you profile the code. If it's waiting, profiling is a waste of a week — you need to find what it's blocked on: IPC, IO, or a lock. State this as the single highest-leverage idea in the talk.
Don't forget: take your time here — this section is 6 minutes for a reason, don't rush into the four states yet.
Timing: 13:45–14:45.
Four states. Each implies a different fix.
Say: Runnable means scheduler contention, not your bug — something else is hogging the CPU. Sleeping is the big one: binder calls, locks, IO. D state is uninterruptible — usually disk or a kernel-level wait that won't even respond to a signal.
Don't forget: explicitly say Runnable is not "my code is slow," it's "the device is busy" — that distinction trips people up.
Timing: 14:45–16:45.
Click the main thread track. Read left to right.
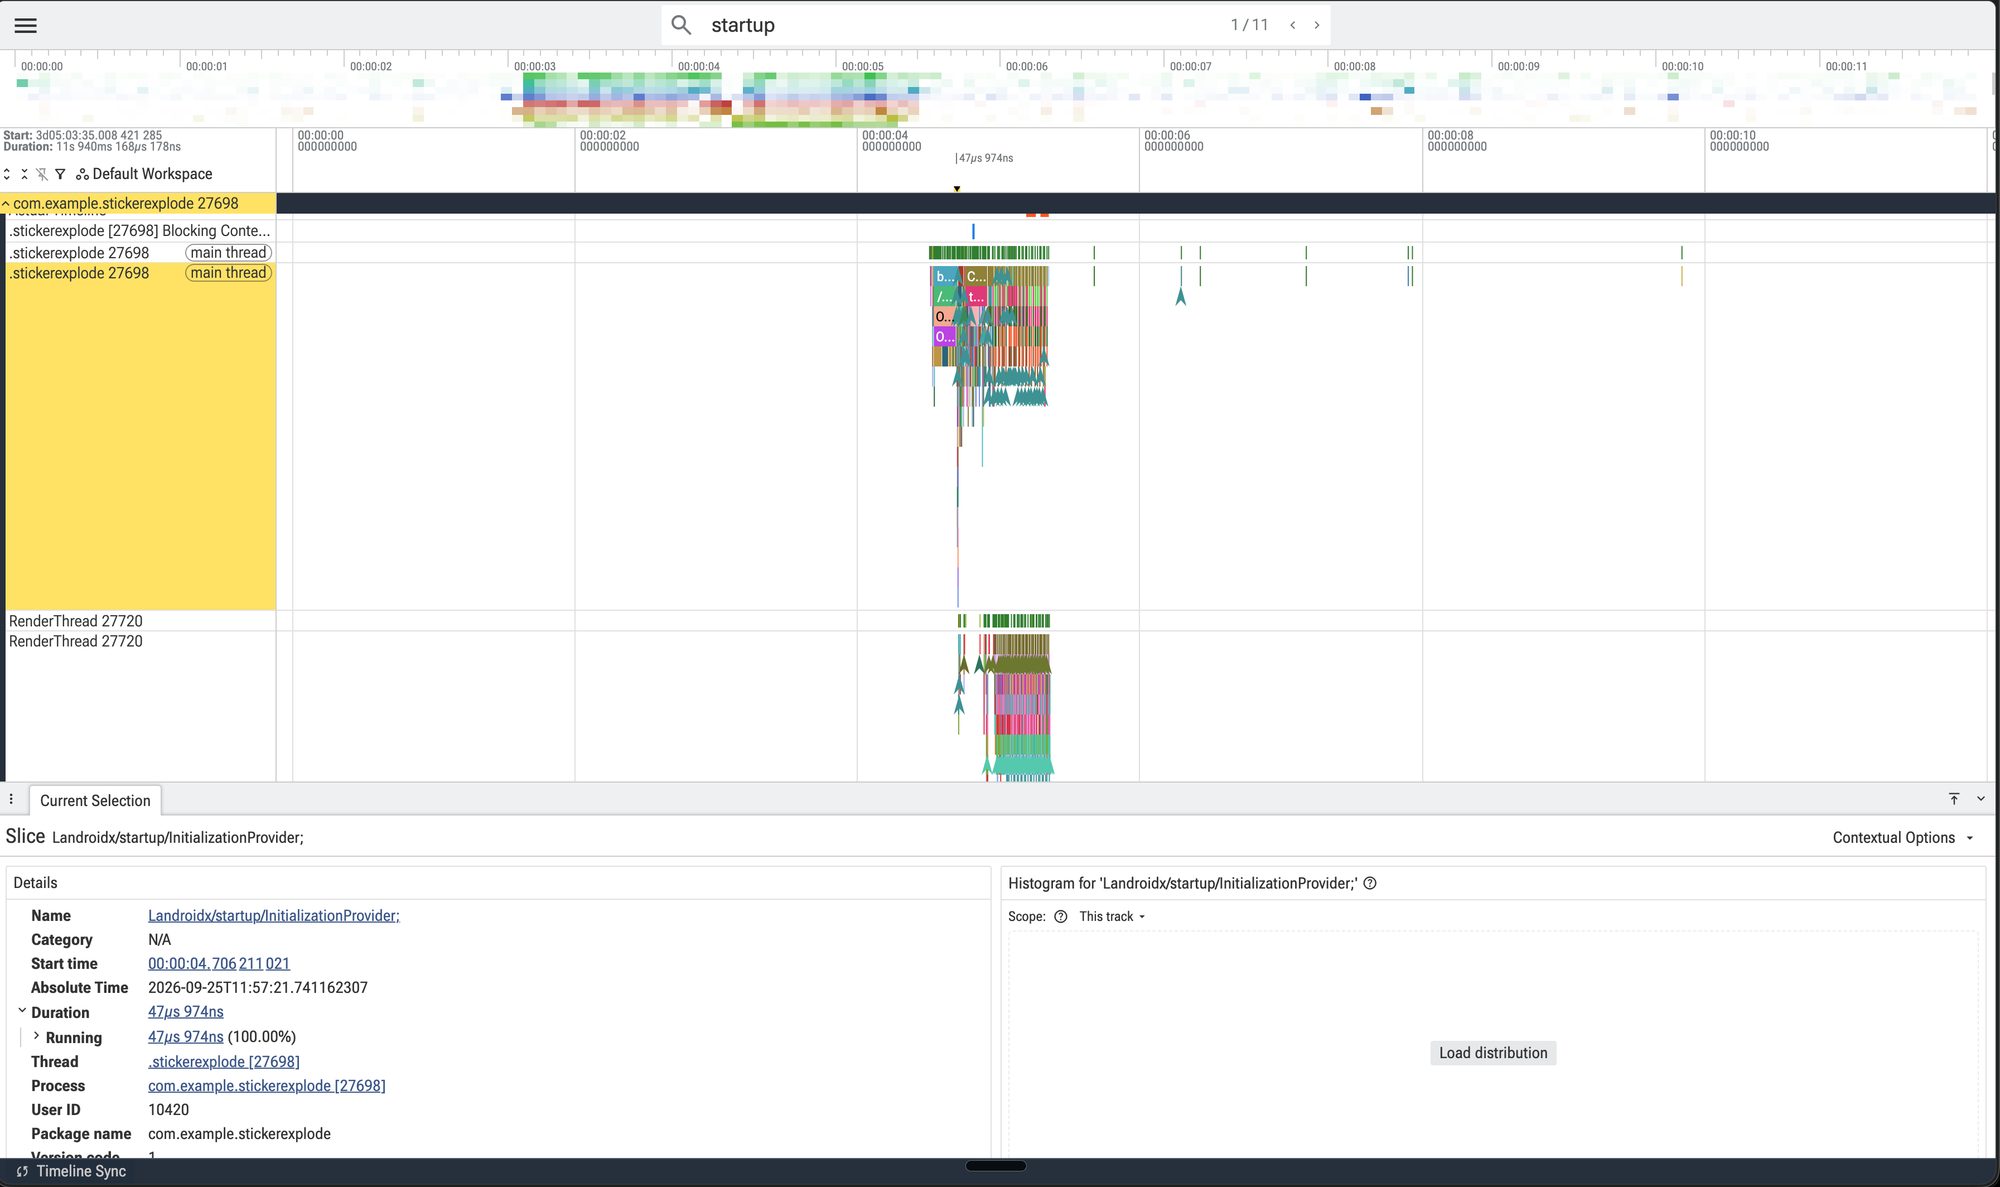
Fallback shown — switch to the live tab if it's cooperating, this real capture covers you if not.
Say: Alt-tab to the real Perfetto UI here if it's loaded and ready — this slide's image is your safety net, not the plan A. Click on the main thread track for the sample app, scroll to the region you'll show as the full-slide diagram next, and narrate what you're clicking as you go — don't drive silently. Say what you're looking for as you click: colored bars are scheduling state (green Running, yellow Runnable, blue Sleeping), and the question you're answering right now is simply "what color is most of this bar" — that's Q2 in one sentence, before the four-state slide formalizes it.
Don't forget: have the trace already loaded and scrolled to position before you alt-tab — dead air while a trace loads kills this section's momentum. If the live switch fails for any reason (wifi, app crash, projector handoff), this slide's own screenshot already shows the real thing — just talk from it instead, don't panic-apologize on stage.
Timing: 16:45–18:45.
65% Running. This app is compute-bound, not waiting.
Say: This is a real capture, not the textbook example — StickerExplode's own cold start. The main thread is Running 65% of the window. That flips the lesson: this app's slow startup is NOT waiting on IPC or a lock, it's genuinely doing work the whole time. Profiling the app's own code here WOULD find something, because the code is actually running. Contrast this explicitly with the waiting-dominant case: same question, opposite answer, and the fix is completely different (optimize the code vs. find what it's blocked on).
Don't forget: say the number out loud with device and build type attached — Pixel 9 Pro Fold, release build. Cold start was unstable across an earlier batch of runs (1502ms / 387ms / one run with no signal at all) — mention that instability plainly if asked, don't hide it. Tonight's own fresh capture, after fixing a debug-build contamination found earlier in the evening, gives a clean 438.88ms TTID — cite that one if asked for the current trustworthy number.
Timing: 18:45–19:45. This is the section people remember — do not rush it even under time pressure.
Which deadline was missed, and by whom?
Every frame owns a deadline. Miss it, and Perfetto can tell you if it was the app or SurfaceFlinger.
Say: Introduce the idea of a frame budget before the numbers: the system gives your app a fixed window to produce a frame, and if you miss it FrameTimeline records who's at fault.
Don't forget: hold off on the exact millisecond numbers until the next slide — don't front-load them here.
Timing: 19:45–20:45.
16.6ms is a 60Hz number. Name the refresh rate.
Say: Say this correction out loud, it buys real credibility in the room: 16.6ms is a 60Hz number, and half the devices in this room are 90 or 120Hz. Its deadline is 16.6ms at 60Hz, 8.3ms at 120Hz — always name the refresh rate next to the number.
Don't forget: don't skip this even if pressed for time — it's a cheap, high-value correctness signal.
Timing: 20:45–21:45.
Frame 3 blew the deadline. FrameTimeline says it was the app.
Say: Walk frame by frame: expected bar next to actual bar, four frames land inside budget, frame three blows through the 16.6ms line and FrameTimeline tags it "App Deadline Missed" — meaning the app, not SurfaceFlinger, owns this one.
Don't forget: explicitly contrast this with a SurfaceFlinger-attributed miss — say what changes about the fix when the attribution flips (you'd stop reading your own code).
Timing: 21:45–23:45.
UI thread built it. RenderThread drew it.
Layout, measure, draw commands. Slow here = your view hierarchy or your code.
Actual GL/Vulkan submission. Slow here = shader compiles, GPU work, driver.
Say: A missed deadline isn't automatically "my code." Split it by thread: if RenderThread is the long pole, you're looking at GPU-side work, not application logic — this is exactly where the shader-jank example belongs.
Don't forget: foreshadow the shader-compile example — say "we'll see this exact shape in the demo later" so it lands as recognition, not a new fact.
Timing: 23:45–25:45.
Where does cold start actually go?
Five phases from process fork to first frame.
TTID = time to the first drawn frame — even an empty loading screen counts, so it can be gamed. TTFD = time to the frame after reportFullyDrawn() — the app has to explicitly say "the real content is now on screen," so it can't be faked the same way.
Say: Cold start isn't one number, it's a pipeline. Naming the five phases up front sets up the diagram on the next slide — don't explain each phase yet, just say there are five and they're sequential. Then land the TTID/TTFD distinction concretely: TTID fires the moment ANY frame draws — even a blank splash screen — so an app can show something fast and claim a great TTID while the real UI is still loading behind it. TTFD requires the app to call reportFullyDrawn() itself, an explicit developer signal that real content is actually visible — there's no cheap way to fake that.
Don't forget: plant the TTID-gets-gamed line here so it lands with more weight two slides from now, where we show StickerExplode never calls reportFullyDrawn() at all — TTFD is permanently null for this app, which is itself a real, reportable finding.
Timing: 25:45–26:30.
TTID: 438.88ms. TTFD: never fires — reportFullyDrawn() is never called.
Say: Narrate left to right: fork, bindApplication, Application.onCreate, activityStart, first frame. TTID for StickerExplode, tonight's own capture, release build: 438.88ms — this superseded an earlier 1502ms figure from a session that turned out to be contaminated by a debug-build install found and fixed earlier tonight; this is the trustworthy number. TTFD is where the honest finding is: this app never calls reportFullyDrawn(), so TTFD is null in every single capture — Perfetto cannot game a number that was never reported, it just tells you the number doesn't exist.
Don't forget: say plainly why TTID gets gamed in general — an app can render an empty frame early and claim a fast TTID while content is still loading behind it — then pivot to "and here, we can't even check, because TTFD was never instrumented." If asked about the earlier 1502ms number anywhere in prior materials: that capture predates tonight's debug-build fix, this 438.88ms is the current, trustworthy figure.
Timing: 26:30–28:15.
Class loading is the Baseline Profile signal.
5,068 classes loaded during startup, 41ms on the critical path — plus 159ms in OpenDexFilesFromOat and 120ms verifying dex. That's a Baseline Profile fix — not a code review finding.
Say: Real number, this app, tonight's own capture: 5,068 classes loaded during startup. Only 41ms sits directly on the critical path — most of the real cost is upstream of that, in OpenDexFilesFromOat (159ms) and dex verification (120ms), both visible on the cold-start chart a few slides back. That's the main thread paying to JIT-compile and verify classes it needs every single cold start — a specific, well-known fix: ship a Baseline Profile so those classes are AOT-compiled ahead of time. This isn't a code review finding, it's a build config finding.
Don't forget: this is the last of the four questions — signal the turn is coming next.
Timing: 28:15–29:45.
That was a checklist.
Checklists are transferable.
Watch an agent run the same one.
Say: Deliver exactly this line, then pause before moving on: "That was a checklist. Checklists are transferable. Watch an agent run the same one." Let the pause do the work — this is the hinge of the whole talk, first half to second half. Be precise if asked: it's one skill (perfetto-triage) with two callable phases, not two separate skills — triage shows the problem, fix changes and re-measures. The next slide names that split explicitly.
Don't forget: physically switch context here — terminal window should already be open behind the deck so the transition to the demo is instant.
Timing: 29:45–30:15. This slide should feel fast, almost abrupt.
Two skills, not one.
Show the issue. The four questions, as SQL, ranked worst-first.
Baseline, change one thing, re-measure, prove it. A separate, callable step.
Say: Shift gears here, explicitly — signal to the room this is the second half. Frame it as two distinct, separately-callable PHASES of one skill (perfetto-triage), not two separate installed skills and not one blended "the agent" step: triage only shows you the problem tree — it never touches code. Fixing is a second, explicit phase that starts from a baseline. Splitting them is what makes "which method is actually causing this" answerable instead of a pile of dense findings.
Don't forget: if asked directly "is this two skills or one" — it's one skill, one SKILL.md, seven steps (0 through 6); Skill 1/Skill 2 is this talk's own framing of steps 0-4 vs 5-6, not the repo's literal structure. Do not claim novelty ("we do something new") — let the specificity of what it actually runs carry the credibility instead.
Timing: 30:15–30:45.
Runs PerfettoSQL. Ranks by self time. Greps slice names to files.
On a real brownfield app: StickerExplode — com.example.stickerexplode.
Say: Describe the pipeline in one breath: capture, parse into trace_processor once, run the query pack, rank hotspots by self time (not total — a wrapper slice inherits everything beneath it), then grep the hot slice names back into the repo. This is Skill 1 only — it shows, it does not touch code.
Don't forget: say "self time, not total" out loud — it's a takeaway line, not just an implementation detail.
Timing: 30:45–31:45.
Most hot slices are framework spans, not your code.
Say: Pre-empt the obvious objection before anyone raises it, and back it with something we actually did tonight: grepped StickerExplode's real source for every hot slice name from the report — waitForever, postAndWait, dequeueBuffer, SensorEventConnection. Zero matches, all of them. Slice names like doFrame or traversal come from the framework, not app code — when that happens, the agent says so, "never instrumented" is itself a valid, actionable finding, and the fix is to add tracing sections and recapture.
Don't forget: this is the single most important credibility line in the whole talk — don't rush it, don't skip it under time pressure. It's now backed by a real command you ran, not just an assertion.
Timing: 31:45–32:45.
One command. Trace in, ranked findings out.
Say: This is the literal command run against tonight's own capture, hours before this talk — not a worked example. If the device is cooperating, run it live on stage; if not, this is the exact command and the exact filename that produced everything in slides 4-13, so say that plainly instead of hedging. Then go quiet. Let the room read the output scroll by rather than narrating over it.
Don't forget: the triage runs in seconds even on a large trace — if you're live, don't fill that silence with chatter, let the fast result land as fast. It found 9 real findings on this exact run: 2 startup, 3 jank, 1 binder, plus info-level notes.
Timing: 32:45–34:45. Don't narrate while it runs.
9 findings, worst first. Each with a next action.
- 🔴 high — Startup dominated by open_dex_files_from_oat (159ms) + verify_class (120ms)
- 🔴 high — 5,068 classes loaded, 41ms on the critical path — Baseline Profile signal
- 🔴 high — 31/31 frames janky, worst overrun 144ms — app-attributed
- 🟠 medium — Cost is on the UI thread: doFrame 539ms vs DrawFrame 405ms
- 🟠 medium — Main-thread binder: SensorEventConnection costs 25ms
- 🔵 info — App never calls reportFullyDrawn() — TTFD unmeasurable
- 🔵 info — Startup is compute-bound: main thread runs 82% of the time
Say: This is the real, complete list from tonight's own run — not a mockup. Read two or three aloud, in the observation-evidence-cause-fix-effect shape the actual report.md uses: pick one 🔴 (high severity) and the compute-bound 🔵 finding, since that second one directly answers "what did the agent even look at" — it checked whether the main thread was RUNNING or WAITING during the whole startup window, the exact Q2 distinction from the method half, and got a real answer: 82% running, so this is a code/JIT cost, not something blocked on IPC or a lock.
Don't forget: every number here is the real measured number from tonight's own capture — say that plainly, it's the credibility of the whole demo. This is where Skill 1 ends — it names problems, it does not touch code.
Timing: 34:45–35:45.
Showing the issue and fixing it are two different jobs.
Skill 2 starts here — and it starts with a baseline, on purpose.
Say: Name the transition explicitly: everything so far only showed the problem tree. Skill 2 is a distinct, separately-invokable step that starts by recording a baseline before touching anything — because "is it actually better" is only answerable if you measured before you changed something.
Don't forget: this is a deliberate pause, not a throwaway slide — it's the answer to "how do you know which method is causing the bug," reframed as process, not magic.
Timing: 35:45–36:15.
Record the baseline before you touch anything.
The baseline: 52/52 frames janky dragging a sticker, worst overrun 131ms, cost on RenderThread.
Say: This is a real captured baseline, not illustrative: StickerExplode, dragging a sticker for 20 seconds, every single frame missed its deadline. Worst frame ran 131ms over — nearly 8x the 16.6ms budget. State the discipline before the fix: without a baseline captured the same way, "it got better" is an opinion. This is the step people skip, and it's the one that makes the rest of the demo honest.
Don't forget: say "reproduce, then measure, then fix, then reproduce again" as the actual loop — not "fix, then measure once." Device and build: Pixel 9 Pro Fold, API 37, release build.
Timing: 36:15–37:15.
Change one thing. Not three.
Self-time pointed at waitForever on GPU completion — traced to a custom AGSL shader (HolographicRenderer.android.kt) drawing full-screen per sticker, every frame, even at rest. The fix: one guard clause, skip the draw when tilt is near-zero. Nothing else touched.
Say: The self-time ranking pointed at GPU/buffer work, not application logic: waitForever on GPU completion (1,171ms self time, the single biggest line in the whole report), postAndWait (515ms), waitForBufferRelease (220ms). State the discipline plainly, then show you followed it: picked ONE of these — the shader draw, since it's app-owned code, not a framework internal — and changed exactly that. One guard clause: if roll and pitch are both under a small threshold, skip the draw entirely. Rebuilt, resigned, reinstalled, recaptured — didn't touch anything else.
Don't forget: this is a methodology point as much as a demo beat — "change one thing" is what makes the next slide's diff mean something. If three things had changed, a partial improvement wouldn't tell you which one worked.
Timing: 37:15–38:15.
Re-measured. One run, honestly labeled — not yet the median of 10.
worst overrun: 69.7ms → 62.1ms. waitForever self-time: 1,171ms → 1,078ms — real, but modest. A NEW finding appeared after the fix: shader pipeline compilation, 199ms, cache-miss on first draw after the skip.
Say: Own this precisely, both the win and its limits. The fix: skip the holographic shader draw entirely when the device is near-flat (HolographicRenderer.android.kt, one guard clause). Rebuilt, resigned, reinstalled the release build, recaptured the identical sticker-picker interaction, re-ran triage. Real result: janky frames 74.5% → 64.6%, worst overrun 69.7ms → 62.1ms. That's real, but it's ONE run each, not the median of 10 the method actually calls for — say that plainly, don't round it up to more confidence than it has.
Say (second half): The more interesting finding is what DIDN'T fully resolve: waitForever GPU-completion self-time only dropped about 8%, and a new finding appeared — shader pipeline compilation cache-misses, 199ms. That means the guard clause helps, but the shader is still compiling/re-triggering more than expected, probably because sensor noise keeps tilt just above the skip threshold during active interaction. That's the honest next iteration, not a finished story.
Don't forget: this is a real demonstration of "change one thing, measure, learn" — including learning the fix was partial. That's a MORE credible demo than a clean 100% win would have been.
Timing: 38:15–39:45.
Tell it a screen. The agent drives, traces, and triages.
| Screen | Janky frames | Worst overrun | Bottleneck |
|---|---|---|---|
| Cold start | 31/31 (100%) | 144ms | UI thread |
| History list nav | 33/50 (66%) | 49ms | RenderThread |
| Sticker-picker sheet | 38/51 (74.5%) | 70ms | RenderThread / GPU |
Bottleneck column uses 40_slice_hotspots (self-time) — the correct ranking. Total-time framing (doFrame vs DrawFrame) alone would have said UI thread here; self-time says GPU completion waits dominate instead.
Say: Everything before this was cold start. This table is the honest expansion, built and captured THIS EVENING, not a roadmap slide: no new script, this agent used ComposeProof's device-interaction tools directly — tap, scroll, back — to drive three different real scenarios while Perfetto was already recording, then handed each trace to the same triage.py, completely unchanged. The tool doesn't care what screen was open; it just reads whatever slices exist. Look at the bottleneck column — cold start alone is UI-thread-bound, the other two are RenderThread/GPU-bound. That's the whole argument for testing every scenario instead of trusting one finding to cover the whole app.
Say (second half): Worth being precise if asked: the sticker-picker sheet's own summary finding initially read "cost is on the UI thread" from the doFrame-vs-DrawFrame total-time comparison — but total time can mislead, because a wrapper slice inherits everything nested under it. The self-time ranking (40_slice_hotspots) tells the real story: waitForever on GPU completion is 1,171ms of SELF time alone, the single biggest line in the whole report — same GPU/buffer-wait pattern as the very first interactive capture from earlier tonight. That's the tool's own stated rule in action: "sorting by total_ms lies."
Don't forget: be precise about what's released vs proven tonight — ComposeProof and this triage skill aren't publicly announced yet. Say plainly: "built and validated live before this talk, releasing properly after." Don't oversell it as a shipped, documented feature. If asked what the sticker-picker sheet actually is: it's the bottom-sheet grid you tap to add a sticker — a LazyVerticalGrid, a completely different UI pattern from a LazyColumn or the cold-start path, and the tool didn't need to know that in advance.
Timing: 39:15–39:45. Thirty seconds — this is a capstone beat, not a new deep-dive.
What automation genuinely can't do here.
- Know that your own custom AGSL shader (HolographicRenderer.android.kt) is the GPU cost — it found waitForever, a human had to open the file
- Compare across builds or devices
- Find a bug a careful human wouldn't
- Not fooling itself — self time, not total
- Refusing cross-build comparisons
- Median, never mean
Say: Be specific about the boundary, don't hand-wave it — use the real example from tonight: the agent's report said "waitForever, GPU completion, 1,171ms self time" and stopped there. It doesn't know that's StickerExplode's own custom AGSL shader in HolographicRenderer.android.kt, running full-screen per sticker every frame. A human had to open that file and recognize it. The agent ranks and names; a person who knows the codebase decides what the name means. It also refuses to compare a debug trace to a release trace, or a Pixel 6 trace to a Pixel 8 trace, because that comparison is meaningless regardless of who runs it.
Don't forget: explicitly say it will not find a bug a human wouldn't — don't let the room think otherwise, someone will test that claim in Q&A if you imply it.
Timing: 39:45–41:45.
The checklist scales. Judgment about your codebase doesn't.
That's not a weakness in the tool. That's the actual division of labour.
Say: Close the boundary section on a clear statement of what's actually being claimed: the four-question checklist and the mechanics of running it scale to a team. Knowing why your app's specific custom shader or layout code behaves the way it does does not, and that's fine — that's what the human is for.
Don't forget: this is a deliberate soft landing before the take-home slide — don't rush past it into the QR code.
Timing: 41:45–42:45.
The mental model, the query pack, the prompt.
Trace triage stops depending on one person.
Say: Say the outcome as an artifact, not a feeling: you're not leaving with "the ability to read a trace" as an abstract skill, you're leaving with a query pack and a prompt that runs the same checklist on your own app tonight.
Don't forget: this callback line closes the loop opened on slide 2 — say "stops depending on one person" clearly, it's the thesis resolving.
Timing: 42:45–43:15.
[TK short URL]
Everything in this talk, runnable tonight.
Say: Point at the URL, say it out loud slowly once, don't rely on people photographing a QR code from the back row — a typeable short URL is more reliable in a dark conference room.
Don't forget: confirm the URL/QR actually resolves before you're on stage — dead link here is a bad last impression.
Timing: 43:15–43:45.
The skill is a start, not an endpoint.
Don't outsource judgment about your own codebase to a tool that's never seen it. Read enough traces yourself that you can tell when the agent's ranking is wrong — that's what actually trains it to get better, not the other way around.
Say: Land this as the actual closing argument, not a hedge tacked on at the end: the four-question method exists so you can independently check the agent's work, not so you can skip learning it. An agent that ranks slices by self-time has no idea which of your team's services is fragile, which fix shipped last sprint, or which finding is "known, already tracked" — that judgment stays yours. The skill scales the checklist. It doesn't replace the person who understands the app.
Don't forget: this is the sentence the whole talk has been building to — say it slowly, don't rush it into the Q&A transition.
Timing: 43:45–44:45. One minute — this is the last idea in the room before questions.
Questions.
Say: Nothing scripted here — open the floor and take questions directly.
Don't forget: if no one asks the first question, have one ready to break the silence: "what's the one class of bug this would never catch?" is a good self-serve one, given the AI-caveat slide right before this.
Timing: 44:45–46:15.
Thank you.
Adit Lal — CTO & co-founder, Travv.world
- aditlal.dev
- topmate.io/aditlal
- linkedin.com/in/aditlal
- x.com/aditlal
- github.com/aldefy
- composeproof.dev
- Rebound (recomposition budgets)
- github.com/aldefy/StickerExplode
- speakerdeck.com/aldefy
Say: Close on the links, not a recap — the recap already happened at the AI-caveat slide. Point at the StickerExplode link specifically and say it's public, so anyone can pull the same traces you showed tonight. ComposeProof and Rebound are the two tools that made tonight's live demo possible — name them explicitly, they're not obligatory sponsor-slide filler, they're what actually ran.
Don't forget: confirm the GitHub handle (aditlal) and Speakerdeck link are correct before presenting — verify live, don't assume from memory. Upload this deck to Speakerdeck after the talk, then the link is real, not aspirational.
Timing: 46:15–46:30. Let it sit on screen through the last question, don't rush off it.